
A loop that improves but leaves no trail is not a system. It's a black box that happened to work this time. Observability is the external memory that makes every round reviewable, every mutation traceable, and every failure searchable.
Without it, you're flying blind.
Prerequisites
- Lessons 01 through 03 of this course (mutation engine framing, genome boundary, and the orchestrator control shell)
- Familiarity with the three-station orchestrator pattern: reader, repair forge, crucible
- Understanding that one round is one atomic experiment (propose, grade, commit or revert)
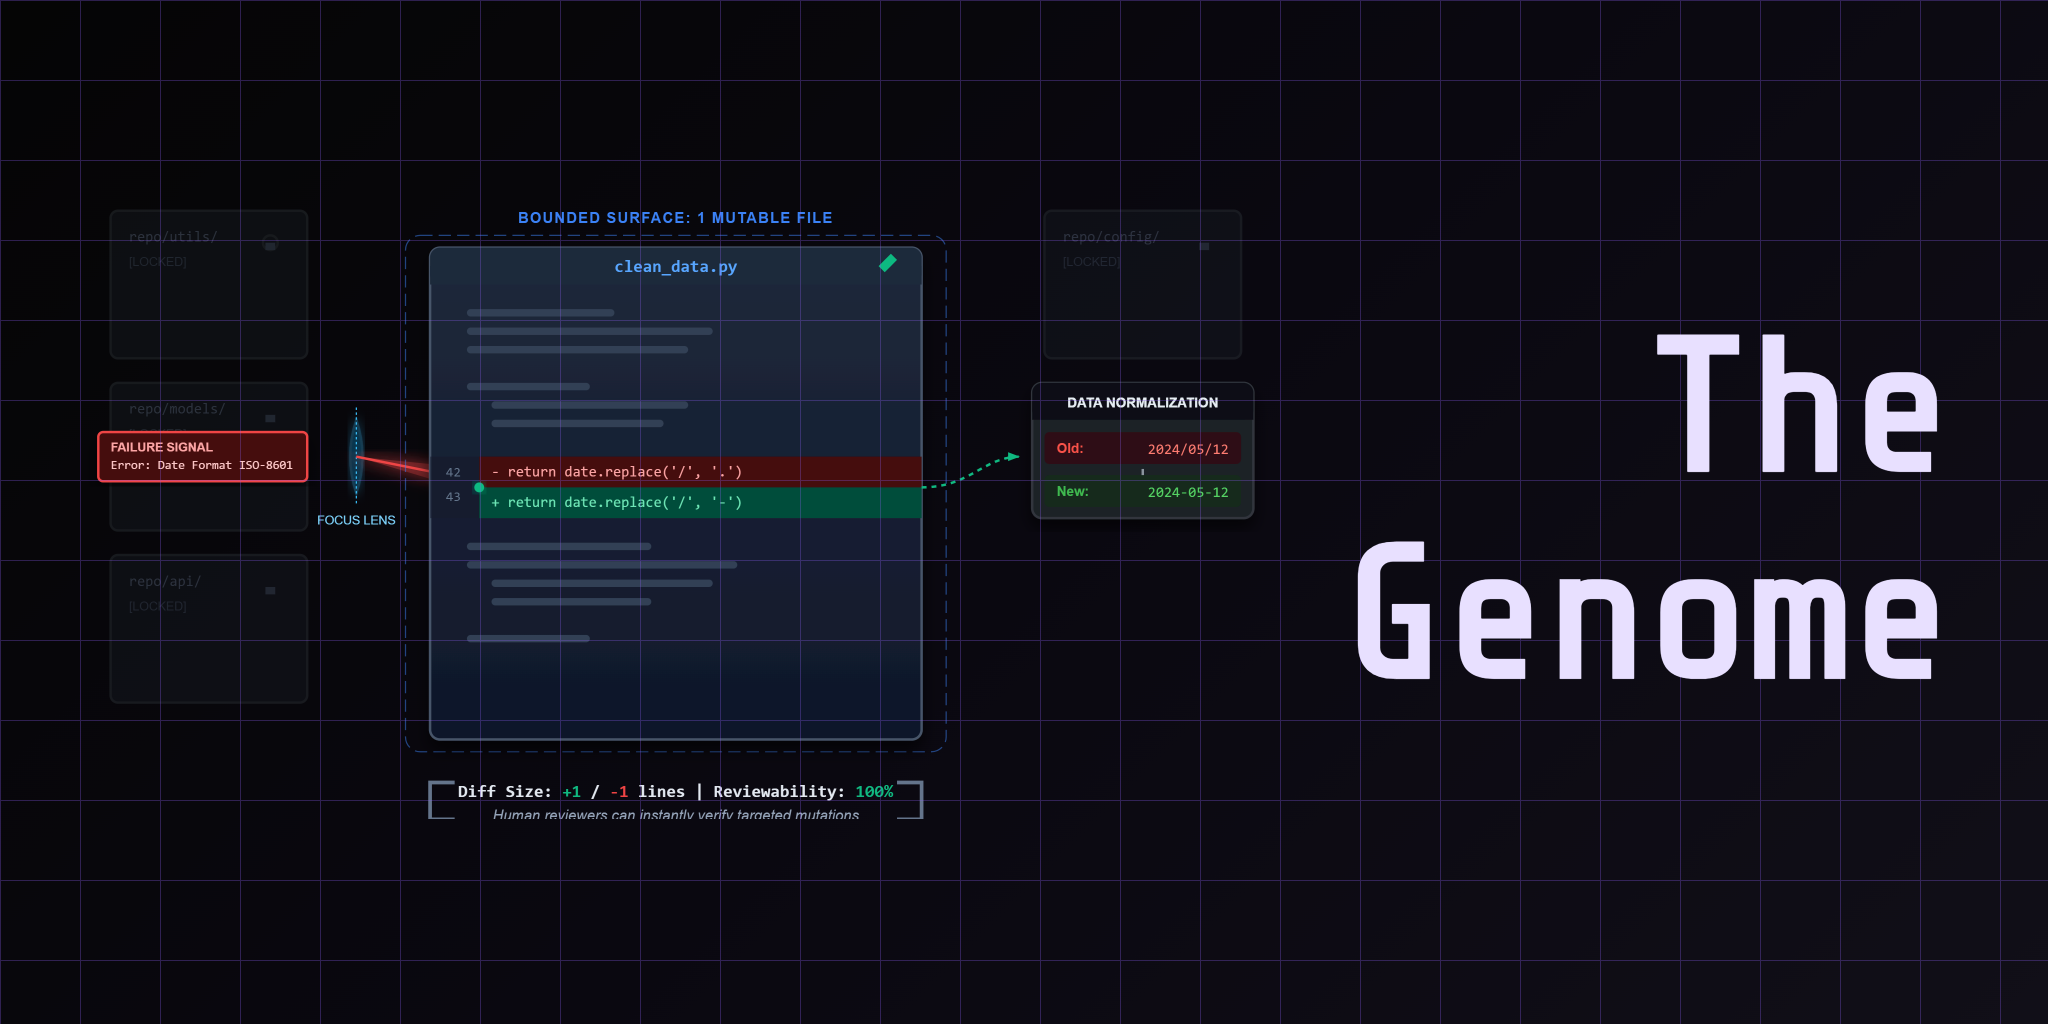
The Blind Loop Problem
You built the loop. The orchestrator proposes mutations. The judge grades them. The system commits or reverts.
But then you close the terminal and come back the next day. What happened? Did the loop improve? Which rows keep failing? Did the model focus on the right thing or chase noise?
If the answer is "I don't know because the loop didn't save any evidence," you have a blind loop.
A blind loop has no external memory. Every round is a transient event. The score might go up or down, but there's no trail to prove why. You cannot debug a regression. You cannot chart improvement. You cannot show a colleague what the system learned.
The problem gets worse under pressure. When a production pipeline degrades, you need to know which mutation caused it. When the loop stagnates at a plateau, you need to see whether the focus area shifted away from the real bottleneck.
Observability is not a dashboard. It's durable history. The loop writes structured artifacts after every round. Those artifacts become the feedback signal for the next round — and the audit trail for the human reviewer.
Score vs Trace
The dashboard needs to answer two questions. Not one. Not five. Two.
Score answers "did this improve?" The number tells you whether the mutation moved the needle. A score of 13 out of 14 is better than 11 out of 14. That's the selection rule.
Trace answers "what happened to this row?" The score alone doesn't tell you why a row failed. Was it currency normalization? Date parsing? Missing value imputation? The trace shows you the individual decision for every row in the dataset.
| Signal | Answers | Artifact |
|---|---|---|
| Score | Did this improve? | finance_eval_history.json |
| Trace | What happened to this row? | row-decisions.jsonl |
Most teams stop at the score. They chart the number over rounds and celebrate when it goes up. But when the score plateaus, they have no way to diagnose why. The trace is what makes the plateau debuggable.
Here's the pattern: score tells you when to keep iterating. Trace tells you what to focus on next.
Row-Level Evidence
The most useful artifact in the loop is row-decisions.jsonl. One line per row. One JSON object per decision. The file makes the pipeline legible at the granularity where data engineering actually happens.
Each row decision records what the pipeline did: the input value, the transformation applied, the output value, and whether the judge passed or failed it. That means you can open the file and see exactly what happened to row 47 — the one that keeps failing currency normalization.
That single line tells you everything. The transform ran. It produced a value. The judge failed it because the expected output was different. You don't need to re-run the pipeline. You don't need to add debug prints. The evidence is already there.
Row-level traces are also the feedback signal for the next round. The reader station compresses repeated failures into one focus area. If rows 47, 52, and 89 all failed on the same transform, the focus is that transform. Not the whole dataset.
The Artifact Trail
The loop writes five key artifacts. Each one preserves a different dimension of the experiment.
.output/finance_eval_history.json — Score deltas across rounds. This is the improvement chart. Open it and you can see whether the loop is climbing, plateauing, or regressing. The dashboard uses this to render the score-over-time visualization.
.output/finance_strategy.json — The metacognition snapshot. What the loop focused on in each round and why. If the strategy shifted from "currency normalization" to "date parsing" between rounds, this file shows the decision trail.
.output/traces/run-events.jsonl — Structural events in the loop lifecycle. Fresh start, score calculation, metacognition, proposal request, mutation commit, revert. This is the timeline of what the orchestrator did, in order.
.output/traces/row-decisions.jsonl — Row-level pass/fail evidence. The most granular artifact. One line per row per round. This is what you inspect when the score plateaus and you need to diagnose the bottleneck.
.output/traces/proposal-events.jsonl — LLM proposal metadata. Which model generated the mutation, what the cost was, which attempt was selected from a best-of-N search. This is the audit trail for the agentic seam.
.output/logs/finance_round_logs.jsonl — Per-round structured logs. Failures, actions, and strategy shifts in a format the dashboard can parse.
You don't need all of them for every task. But the pattern is consistent: score for improvement, trace for diagnosis, strategy for focus, events for timeline.
Missing Artifacts as Feedback
Here's the thing most teams miss: a missing artifact is still feedback.
If row-decisions.jsonl is empty for a round, that means the pipeline didn't execute. The mutation was so bad that the judge couldn't even run. That is useful information. It tells you the search space broke. The loop should revert and narrow the mutation surface.
If finance_strategy.json doesn't get updated, the reader station didn't run. The loop might be stuck in a propose-then-commit pattern without evidence compression. That's a bug in the orchestrator flow.
If proposal-events.jsonl shows zero proposals, the LLM didn't respond. Network timeout. Rate limit. Token budget exhausted. All of these are signals that the loop should back off and retry.
Missing artifacts are not gaps in your observability story. They're signals about what the loop couldn't do. Treat them the same way you treat a failing test: investigate, fix, and move on.
The Dashboard as Operator Surface
All those artifacts are useless if you can't read them. The dashboard is the operator surface — the review interface that turns JSONL files into visual evidence.
The Clean Loop dashboard (dashboard.py) loads finance_eval_history.json and renders score-over-time. That's the primary view. You open the dashboard and immediately see whether the loop is improving.
But the dashboard is more than a chart. It's the interface between the loop and the human reviewer. When the score plateaus, you drill into the row-level traces. When a mutation looks suspicious, you check the proposal events. When the strategy shifts, you review the metacognition snapshots.
The util.py file exposes observe and dashboard commands. The observe command collects artifacts from the .output directory. The dashboard command launches the Streamlit interface. That's the full observability surface: collect, load, visualize.
The dashboard doesn't need to be pretty. It needs to be fast and accurate. You're not building a product UI. You're building a debugging surface.
Trade-offs
Lightweight JSON artifacts have trade-offs. You need to understand them before you commit to the pattern.
The good: JSONL files are cheap. You can write them with a single print statement. They're human-readable. You can grep them. You can pipe them to jq. The dashboard loads them with json.load(). No database. No infrastructure.
The bad: JSONL files don't scale to high-throughput pipelines. If you're processing millions of rows per round, the trace file gets large. You'll need to sample. You'll need to compress. You'll need to rotate.
The alternative: Full observability stacks like Grafana and Prometheus. They handle high throughput. They provide alerting. They integrate with existing monitoring infrastructure.
The cost: Grafana requires infrastructure. Prometheus requires agents. You need to maintain the stack. You need to configure dashboards. The barrier to entry is significantly higher.
The right choice depends on your scale. For a tutorial loop that processes 14 rows, JSONL is perfect. For a production pipeline that processes 14 million rows, you'll want a proper observability stack.
The pattern transfers. The score-vs-trace split stays the same. The artifact trail stays the same. Only the storage layer changes.
Bridge to the Next Lesson
Observability is not the end of the loop. It's the foundation for the next stage of autonomy.
When the loop can see its own evidence, it can challenge its own strategy. "I've been focusing on currency normalization for five rounds. The score hasn't moved. Maybe I should shift to date parsing."
That is self-challenging behavior. The loop questions its own focus area. It uses the artifact trail to detect stagnation. It proposes a strategy shift instead of another mutation of the same transform.
Lesson 05 covers self-challenging loops. The loop uses observability to detect when it's stuck. It uses the evidence trail to propose new directions. The dashboard becomes the interface for reviewing strategy shifts, not just score improvements.
Observability enables autonomy. Without external memory, the loop can't learn. With it, the loop can challenge itself.
Related Reading
- Previous: Lesson 03: The Orchestrator — Why the loop needs a control shell around the LLM to coordinate repair attempts.
- Next: Lesson 05: The Judge & Self-Challenging Loops — Why harder data beats easier grading and how the loop challenges itself.
- Project anchor: CleanLoop Example — Inspect the artifacts, dashboard surface, and trace files that make the feedback loop legible.
Next Steps
This article covers observability — the external memory that makes the loop reviewable and the evidence trail that enables self-improvement. The full lesson includes a video walkthrough, a live demo of the dashboard, and a deep dive into row-level traces.
Watch Lesson 04: Observability & The Feedback Signal
Next in series: Lesson 05 explores self-challenging loops — how the loop uses observability to detect stagnation and shift strategy.
The full course and example code are open source on GitHub.
This article is part of the Self-Evolving Data Engineer series. The loop only learns when it can see what it did.